Suppose you had a perfectly symmetric, unimodal distribution. It would look like the well-known bell curve. Of course, in the real world, nothing is perfect. But in statistics, we talk about ideal distributions, known as "models." Real-life datasets can only approximate the ideal model...but we can apply many of the traits of models to them.
So let's talk about a perfectly symmetric, bell-shaped distribution for a bit. We call this model a Normal distribution, or Normal model. Because we're dealing with perfection, the mean and median are at the same point. In fact, there are an infinite number of Normal distributions with a particular mean. They only differ in width. Below are some examples of Normal models.

Notice that their widths differ. Another word for "width" is "spread"...which brings us back to Standard Deviation! Take a look at the curves above. In the center section, the shape looks like an upside down bowl, whereas the outer "legs" look like part of a right-side-up bowl. Now imagine the point at which the right-side-up parts meet the upside-down part. Look below for the two blue dots in the diagram. (P.S. They are called "points of inflection," in case you were wondering.)

So, there are two measures that define how a particular Normal model will look: the mean and the standard deviation.
I'd be remiss if I didn't tell you that there is a formula for numerically finding the standard deviation. Luckily, there's a lot of technology out there that automatically computes this for you. (I showed you how to do this in MS-Excel in an earlier post.)
Suppose you have a list of "n" data values, and when you look at a histogram of these values, you see that the distribution is unimodal and roughly symmetric. If we call the values x1, x2, x3, etc. We compute the mean (average, remember?) and note it as x with a bar over it. Then the formula is:
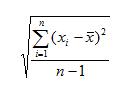
What does the ∑ mean? Let's take the formula apart. First, you are finding the difference between each data value and the mean of the whole dataset. You're squaring it to make sure you're dealing only with positive values. The ∑ means you should add up all those positive squared answers, one for each value in your dataset. Once you have the sum, you divide by
(n-1), which gives you an average of all the squared differences from the mean. This measure (before taking the square root) is called the variance. When you take the square root, you have the value of the standard deviation. So, you see, the standard deviation is the square root of the squared differences from the mean.
Well, that's a lot to digest, so I'll continue with the properties of the Normal model in my next post.
Thank you for your information. It very nice article.
ReplyDeleteData Science Training in Pune
There are actually fancier solutions to arrange a penning utilizing tactics prefer comparison/contrast as well as pro/con buildings. https://imgur.com/a/nHYPb52 https://imgur.com/a/dKNYqqD https://imgur.com/a/ml462C6 https://imgur.com/a/4msQR7a https://imgur.com/a/CEHZ48N https://imgur.com/a/HIJT8dz https://imgur.com/a/on4G5Mv
ReplyDelete